|
Water-Related Impacts at the Pebble Mine Prepared by Dr. Robert Moran, Michael-Moran Assoc., LLC Metal mines throughout the world have degraded water quality and require enormous volumes of water. Mining affects water quantity and quality and ways in which the Bristol Bay watershed may be vulnerable should the Pebble Mine be developed.
WATER QUANTITY Modern metal mining requires massive volumes of water, which are typically diverted from fisheries, domestic, recreational, and agricultural uses, thus increasing competition for water. For example, diversion of lake water in the Andes by Southern Peru Copper Corp. has dried up lakes and surrounding meadows used for fishing and grazing. Developing and operating the Pebble Mine would require billions of gallons of water each year of mine operation. Northern Dynasty Mines, Inc. (NDM) applied to the State of Alaska in July of 2006 for water rights in the following amounts (in gallons per year):
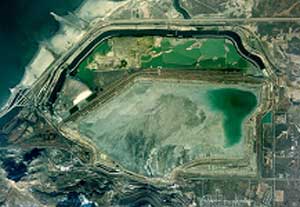
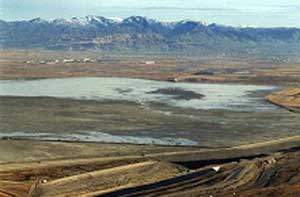
WATER QUALITY Site operation chemicals: Mine operations use tremendous amounts of chemicals– explosives, fuels, oils, greases, antifreeze, water treatment chemicals, herbicides, pesticides, and road de-icing compounds – that may be released into local surface and groundwater and can be toxic to fish and wildlife. Tailings: Ore is pulverized and mixed with water and chemicals that separate copper, gold and other metals from the rock. More than 99 percent of processed ore becomes a solid-water-chemical waste called tailings that will be permanently stored within large impoundments. Tailings contain process chemicals and elements from natural rock that can harm humans and wildlife. For example, 2 parts per billion concentrations of copper above background may negatively affect the ability of salmon to locate their spawning grounds.2 Other natural rock elements may include aluminum, antimony, arsenic, barium, cadmium, chromium, cobalt, iron, lead, manganese, mercury, molybdenum, nickel, selenium, silver, thallium, zinc, sulfides, and natural radioactive constituents (uranium, thorium, potassium-40). Process chemicals in tailings may include lime, sodium isopropyl xanthate (e.g. SF-113), dithiophosphate and thionocarbamate (e.g. Aeropromotor AC 6682), methyl isobutylcarbinol (MIBC), and polypropylene glycol methyl ether (Dowfroth 250). Some of these chemicals are recycled but most are discharged with the tailings. RISK OF LEAKAGE Copper mines frequently operate for 50 years or more. Tailings impoundments must hold the waste forever and are vulnerable to natural forces such as erosion, landslides and earthquakes. Seepage is collected and returned to the impoundment during operations, but this process usually stops when mining ceases. Inevitably, some of the “chemical soup” seeps out into the surrounding ground and surface waters. The Bingham Canyon Mine, like Pebble, is a copper/gold/molybdenum mine, currently the largest in North America with an ore body roughly half the size of Pebble. Pollution from the mine has contaminated 60 square miles of groundwater near Salt Lake City, making water unusable for at least 4,300 households. Kennecott Utah Copper Corp., a subsidiary of Rio Tinto, built a multi-million dollar water treatment facility, the largest of its kind in the United States, to treat an estimated 2.7 billion gallons of polluted water annually for at least the next 40 years.
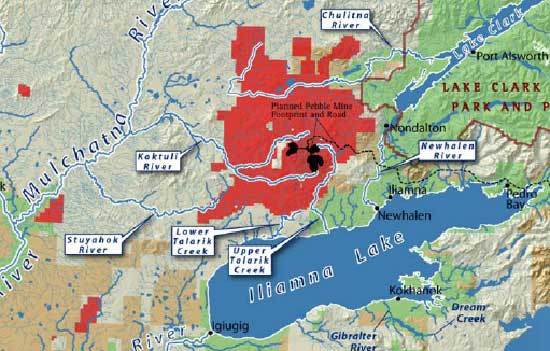
The proposed Pebble Mine has similar potential to contaminate ground water. It is located in the headwaters of Bristol Bay, a pristine region laced with streams, rivers and lakes. The extensive glacial gravel deposits are highly permeable, a characteristic that contributes to salmon productivity but also provides pathways for water and potentially for mine wastes to move between surface and groundwater and between river basins. Salmon have adapted to the local surface water, naturally pure with extremely low concentrations of dissolved minerals; even minute amounts of contaminants can potentially impact salmon. Modern metal mining operations throughout the world have degraded water quality and increased competition for water. These impacts often do not become apparent until after mine operations cease. Text by Moran, R. 2007. Pebble hydrogeology and geochemistry issues.
Water Impacts Fact Sheet (pdf file 351 kb) Further Reading and References Brabets, T.P., 2002, Water quality of the Tlikakila River and five major tributaries to Lake Clark, Lake Clark National Park and Preserve, Alaska, 1999-2001: U.S. Geological Survey Water-Resources Investigations Report 02-4127, 29 p Hall, J.D., 1995, Overview of environmental and hydrogeologic conditions at Iliamna, Alaska: U.S. Geological Survey Open-File Report 95-346, 6 p. |
|||||||||||||||||


